
Video Game Sales Data Visualization
ABOUT THIS PROJECT
This project aims to explore video game sales from different regions of the world by using the "Video Game Sales" dataset provided by a webscrape of VGChartz. The dataset contains 11 fields and over 16,598 records of video games with sales greater than 10,000 copies. Each record includes a breakdown of the video game’s name, rank, platform, year, genre, publisher, and sales (in North America, Europe, Japan, and worldwide).
As the dataset contains over 16,000 records, I used Python to create several scripts that can extract different sets of data to see if I could find any compelling patterns and trends. Some analyses include: looking at global sales and pulling out specific video games and their sale records. I used Jupyter Notebook and Pandas Library to run my python scripts, then Tableau Public and Word Clouds to create my visualizations.
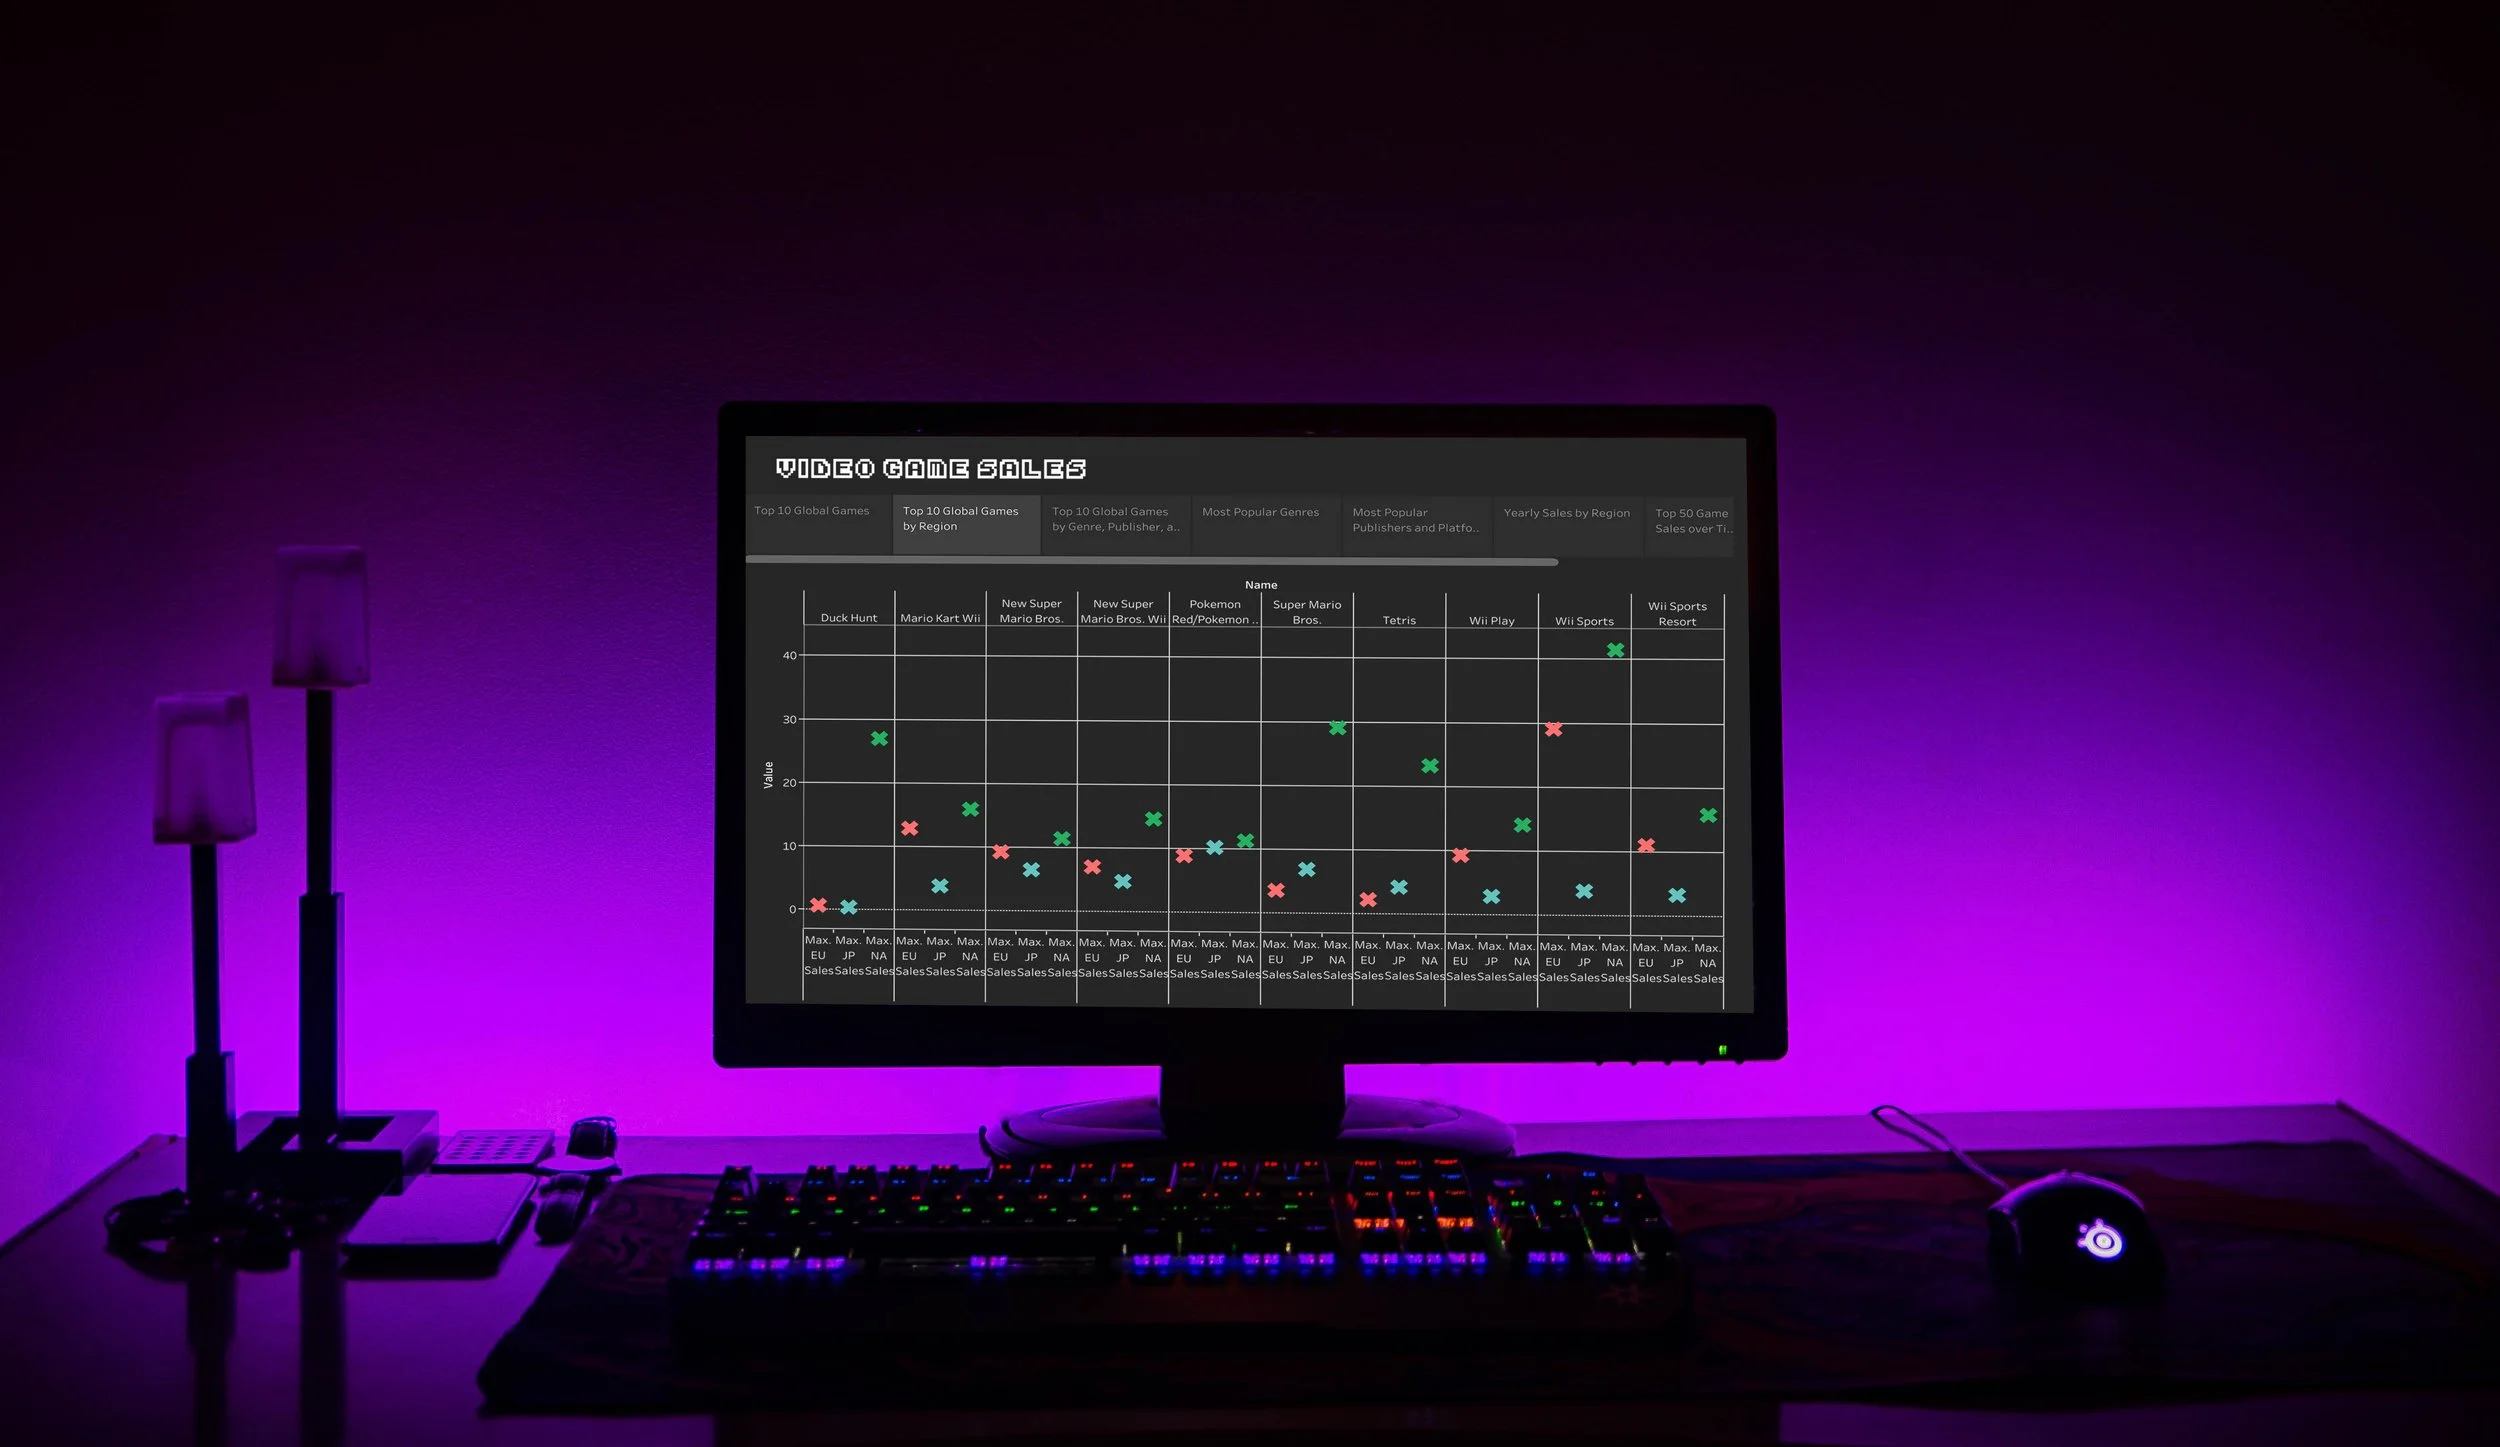
The first python script was used to count the number of video games and look at the top 10 most sold video games. The second python script was used to extract different sets of data and look at the max games sold by region, platforms, and genres. This new modified CSV file was imported into Tableau Story where I created a total of 8 visualizations.
DATE
May 8, 2021
DATASETS
DATA VISUALIZATION TOOLS
Jupyter Notebook
Python
Tableau Public
Pandas Library
Word Clouds
For convenience, the Jupyter Notebook is also embedded below.