
A Data Analytics Evaluation Story
The Monterey Bay Aquarium
Seafood Watch Program
Scroll ↓
ABOUT OUR PROJECT
Seafood Watch is a program of the Monterey Bay Aquarium that seeks to transform the seafood industry by helping seafood industry professionals to everyday consumers make better seafood choices.
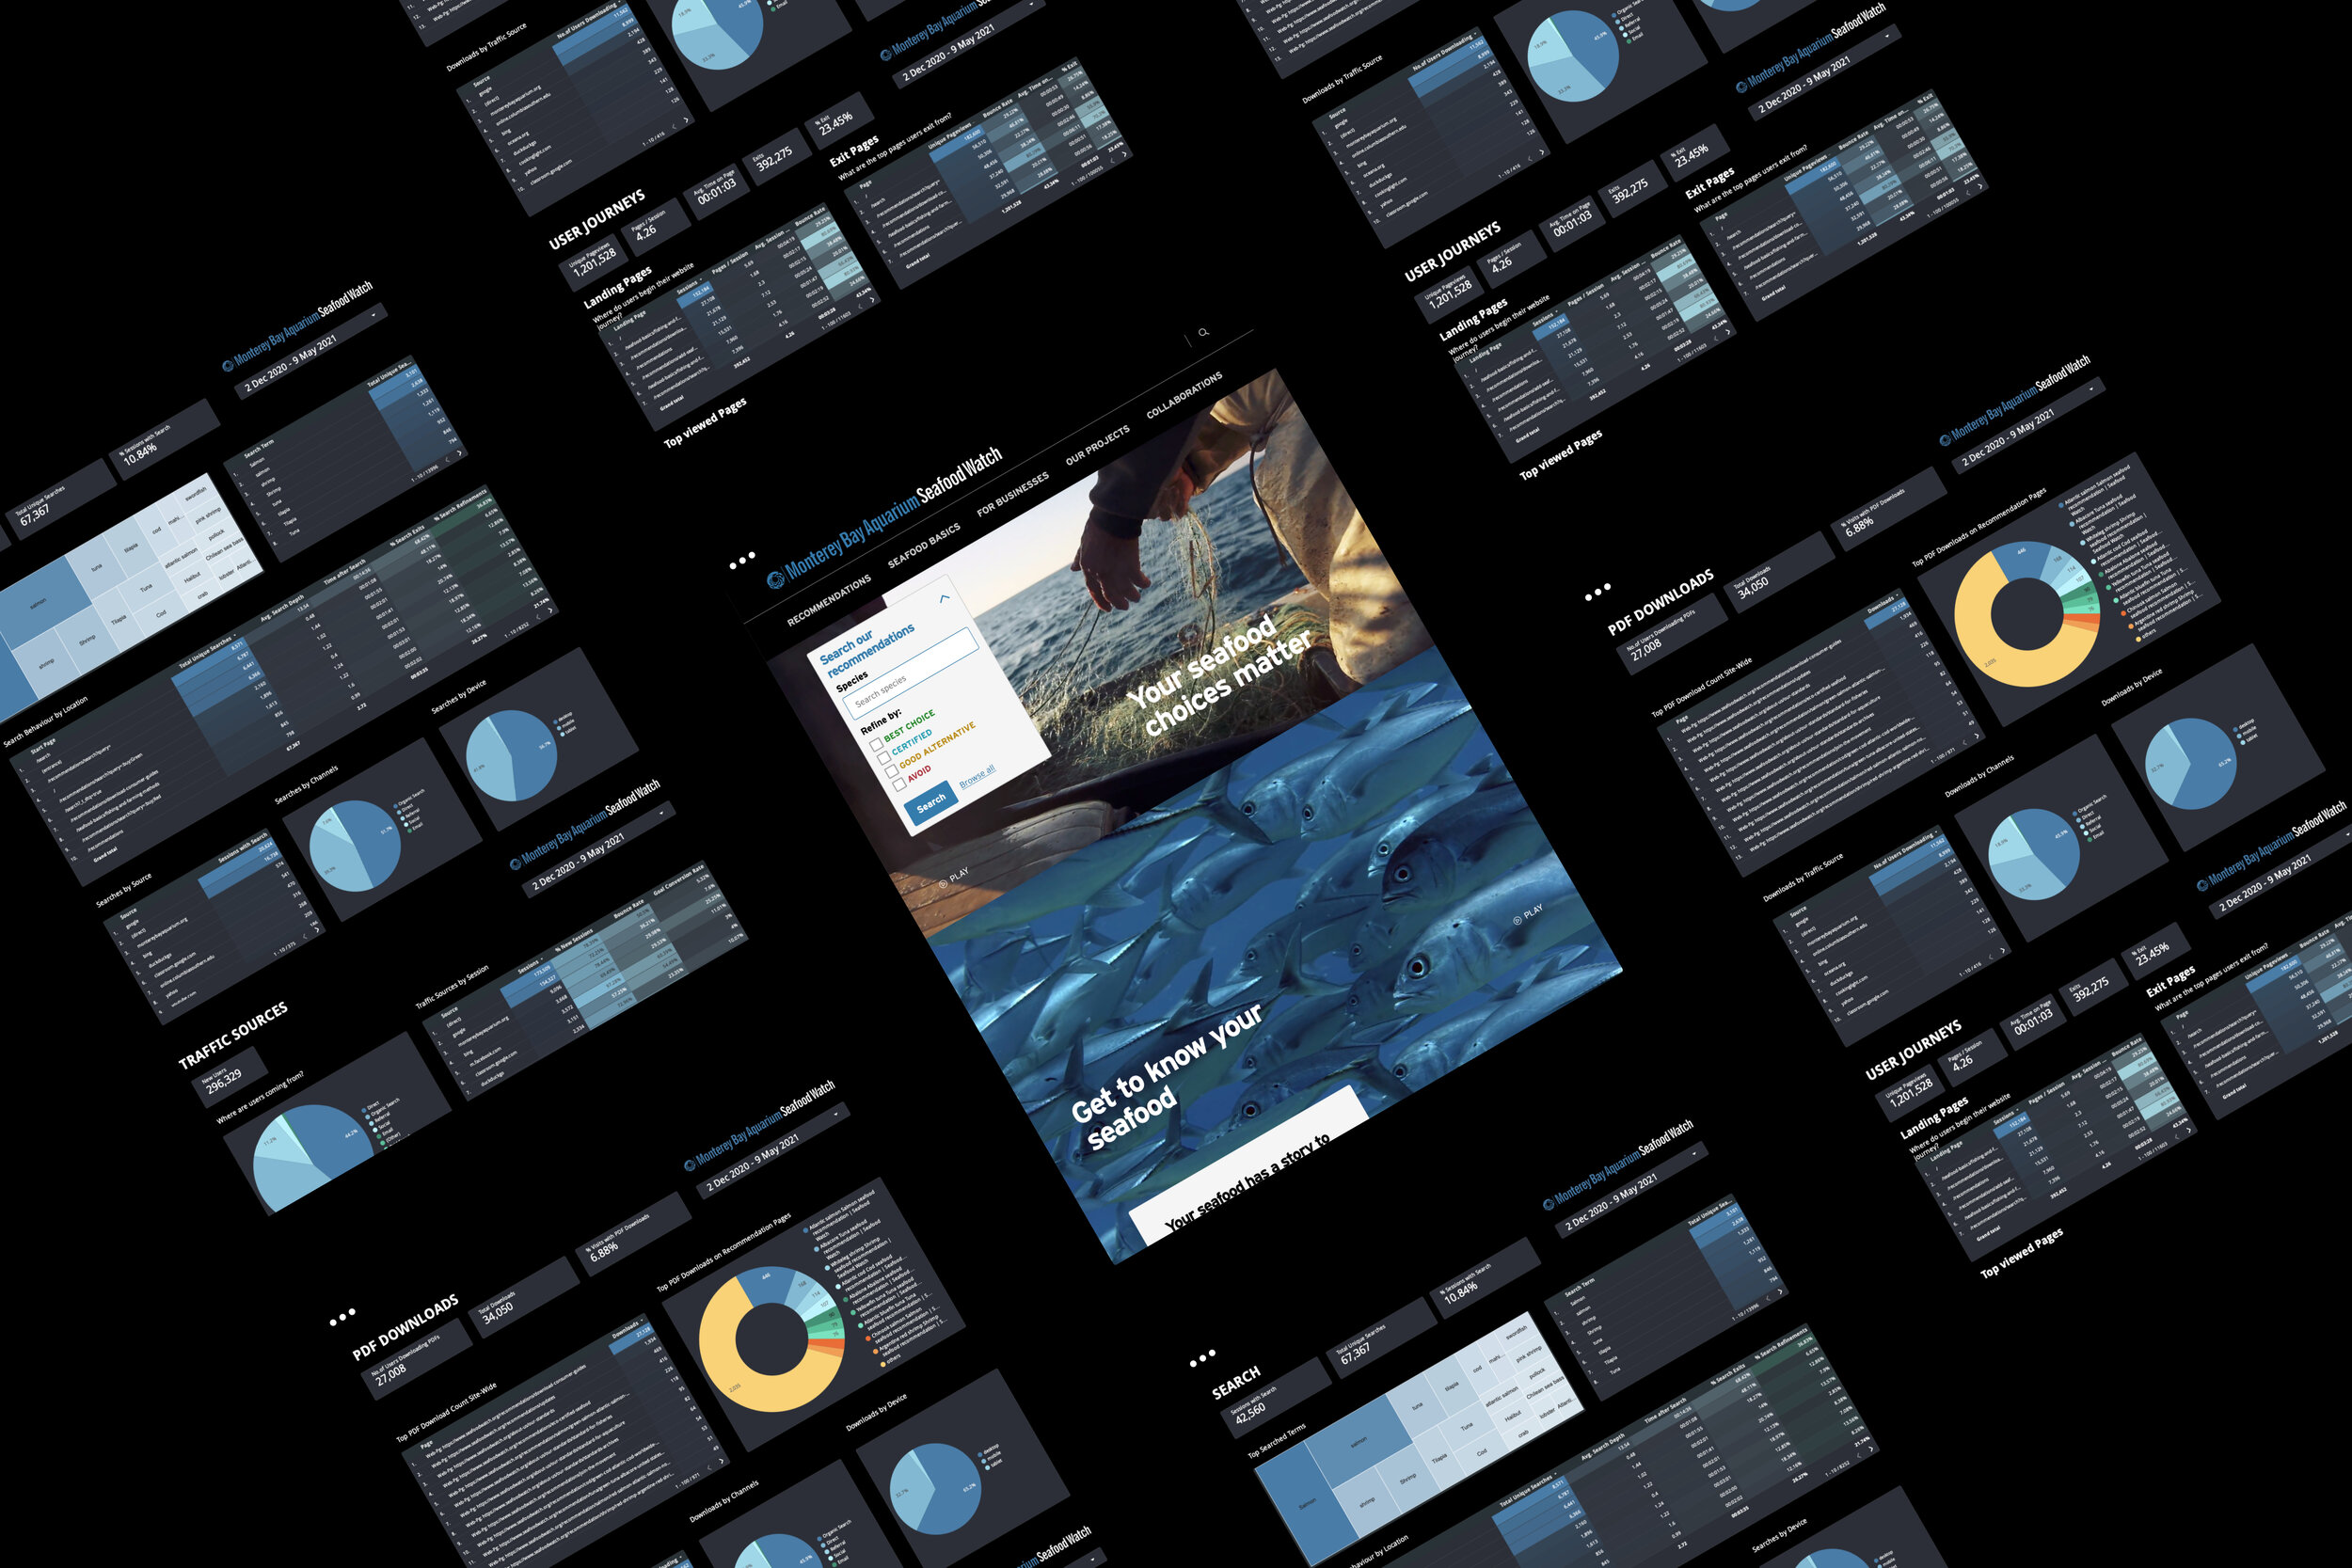
Our team of four graduate students from the Info-685 Digital Analytics course at Pratt Institute’s School of Information partnered with Seafood Watch to provide a thorough analysis of their website using Google Analytics and Google Data Studio. Four major recommendations were uncovered to improve the overall user experience and help target users find information more efficiently.
CLIENT
TIMELINE
6 weeks (March 2021 - May 2021)
DATA ANALYTICAL TOOLS
Google (Analytics, Data Studio)
DESIGN TOOLS
Adobe InDesign
MY ROLE
Our team worked collaboratively to submit a dashboard and a written report with mockup recommendations as our final products.
My roles included:
Analyzing user journeys data including landing, exit, and popular pages
Creating user journeys dashboard and mock-up recommendations for the written report
Preparing final slides presentation
TEAM MEMBERS
Amiya Dewan
Marisa Kurtz
LeMark T McPherson
PROJECT PATH

01.
Preparation
SETTING GOALS
In the kickoff meeting, our client revealed they had recently relaunched their website in December 2020 and haven’t had the opportunity to perform analytics.
With four months of data to analyze, they are curious to know how their buyers, retailers, and consumers are accessing and searching their recommendations database and if they are downloading their PDF consumer guides.
OUR CHALLENGE
With the client’s goal in mind, we framed our challenge as:
To analyze how Seafood Watch users are utilizing search capabilities
To provide recommendations that can improve the user’s satisfaction and help users find information more efficiently
“How can we make a large amount of scientific data compact and understandable for a wider audience so users can utilize and use those recommendations to guide purchasing behavior?”
02.
Methodology
DATA ANALYTICAL TOOLS
Our team utilized Google analytical tools to help us understand user search behavior and improve the kind of results they are getting.
1. Google Analytics vs. SiteImprove
Seafood Watch employs two analytic tools: Google Analytics and SiteImprove. We quickly noticed discrepancies between the two data sets based on how and when they acquired data, and as a team, we decided to focus on the former because we felt comfortable interpreting data on that platform. The strength of Google Analytics is it provides helpful user journeys for landing pages which will allow us to see how users are getting to the recommendations. However, a limitation is the behavior flow charts can only be screenshotted and cannot be transferred to Data Studio.
2. Google Data Studio
Our team created an interactive dashboard to help Seafood Watch quickly access all of their data in one place. The strength of using this platform is it allows us to create a multi-paged dashboard organized into specific areas of focus. The platform also has date controls that allow users to change the range from date, month, or year.
TIME FRAME
December 2, 2020 - Present
RESEARCH OBJECTIVES
We laid out four research objectives to help guide our user search analysis:
How are users utilizing search options on the website?
Which search locations are users operating?
What are users searching for?
Do users appear satisfied with their search results?
03.
Communicate
OVERALL FINDINGS
Overall, we found Seafood Watch’s redesigned website to already be SEO optimized and their recommendation database easily discoverable. Since our client asked for specific analysis on user search behaviors, we decided to focus our findings and recommendations on four specific areas: Search Location and Content, User Journeys, Website Traffic Source, and PDF Downloads.
FINDINGS & RECOMMENDATIONS
Search Location and Content
Findings

Seafood Watch 2021 Dashboard - Start Page Search Behavior
Most users search using the Global Search bar. The Global Search has a much higher percentage of Search Exits (70.32%) compared to the Recommendations page search (18.28%). This could indicate users find what they are looking for immediately and exit without exploring further. However, the Average Search Depth, Time after Search, and % Search Refinements are high. This means it could also indicate users are having to refine their search multiple times and click on different pages to find what they are looking for.
Google Analytics - Landing Pages
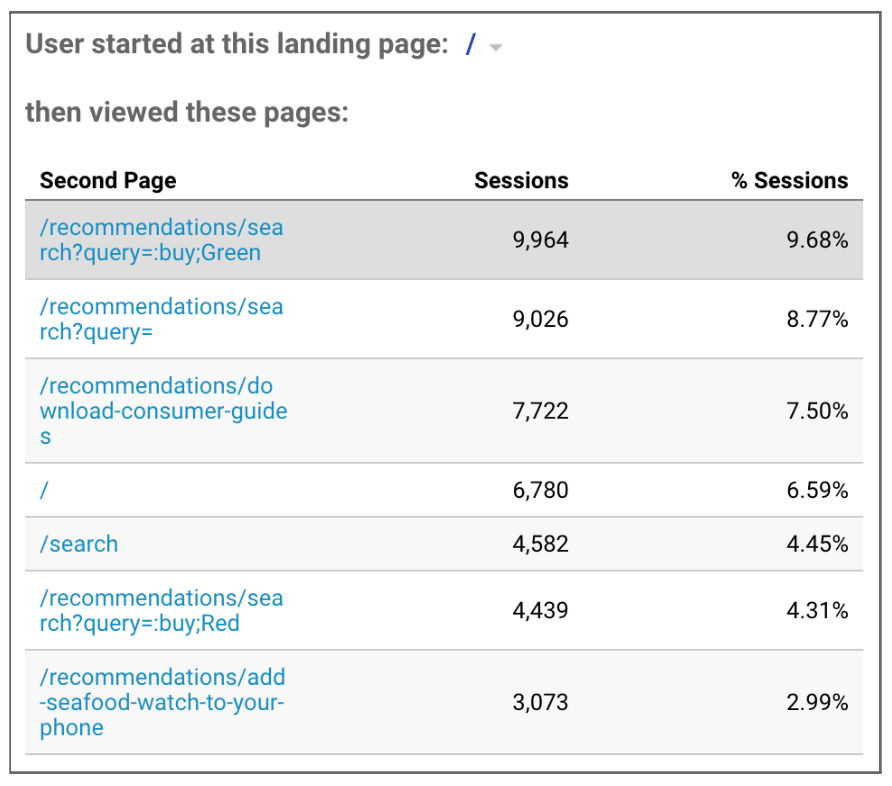
Most users starting on the Home Page get to the Recommendations by using the Search Block and selecting “Best Choice” (9.68% sessions). The second choice is navigating to the Recommendations Search Page (8.4% sessions). They are least likely to use Global Search (4.52%).

Seafood Watch 2021 Dashboard - Top Searched Terms
Most users search for specific fish species. Salmon is the most searched term followed by shrimp. However, Google Analytics separates search terms by case, making it difficult to visualize the total entries for each term.
Recommendation
1. Make Recommendations Search bar more visible and add predictive search to help guide users.
Before: Website’s Recommendations Page
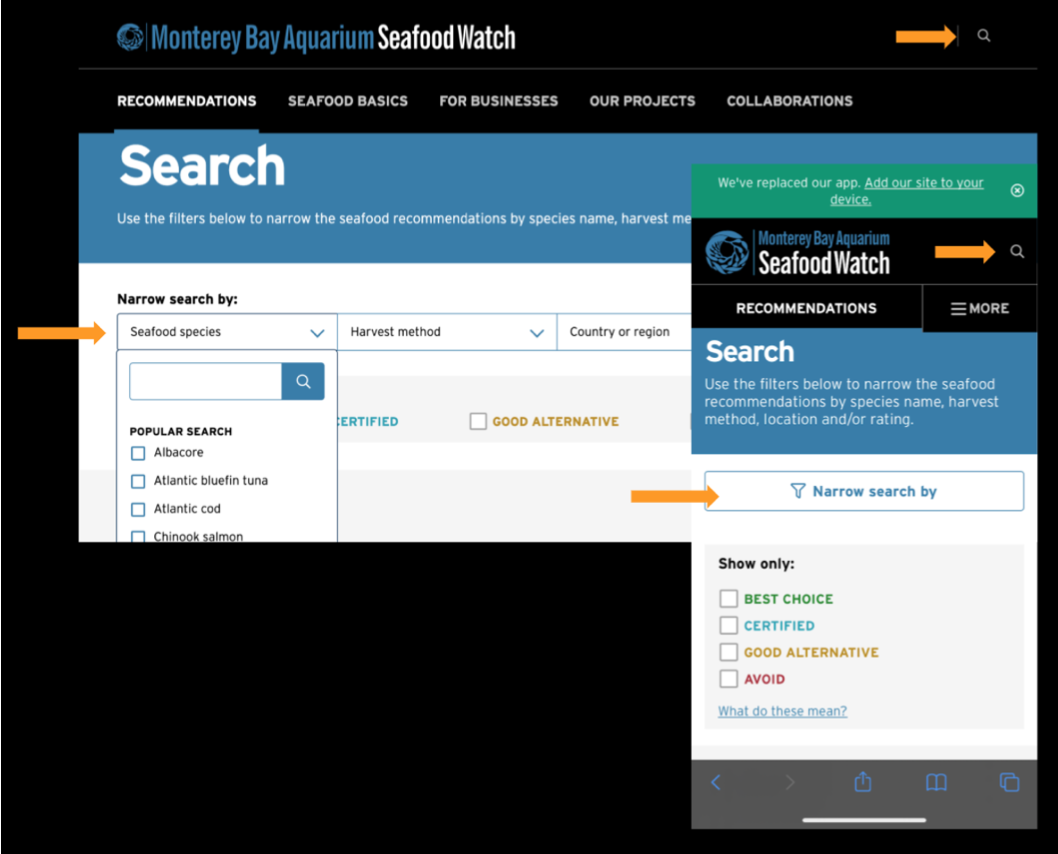
The Search bar on the Recommendations page is not immediately discoverable upon entering the page. On mobile, it even requires an extra step. The low visibility of the Recommendations Search bar compared to the Global Search bar could be the reason most users type into the latter.
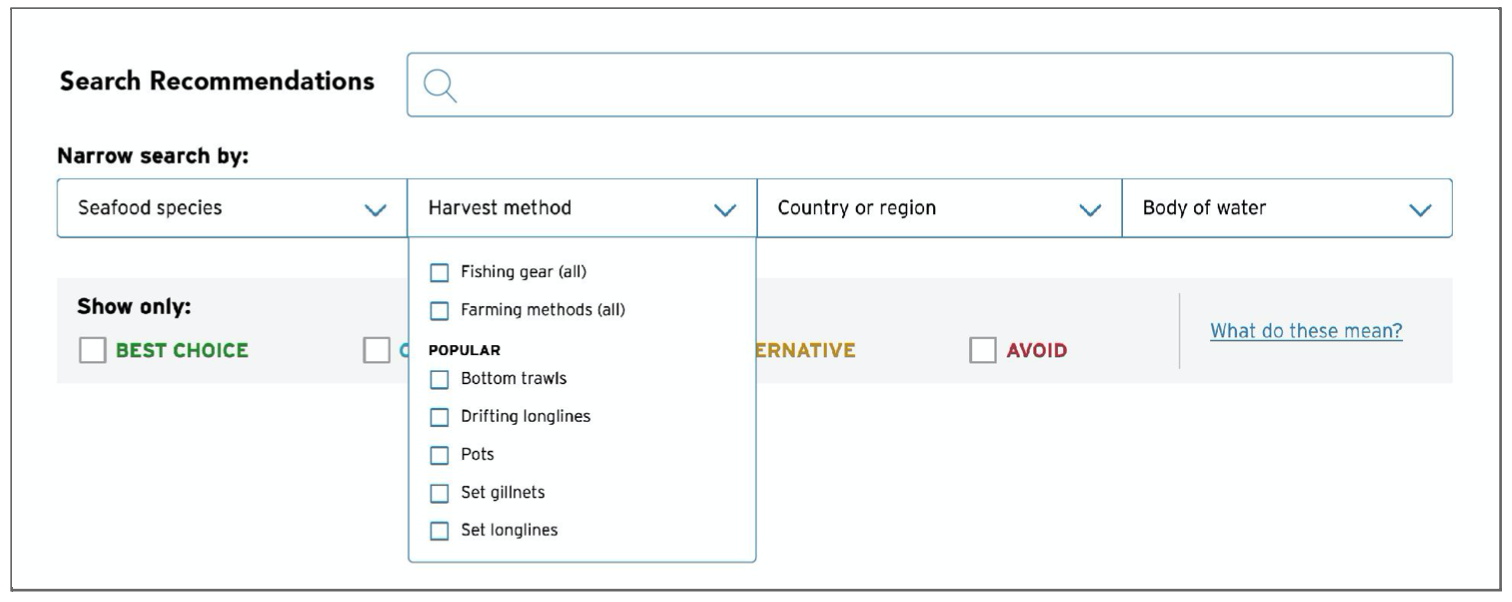
After: Mockup showing unified search bar and filters as dropdown options
As most users are searching for species and almost half are searching on mobile, it will help to make the Recommendations Search bar visible upon entering the page on both desktop and mobile. Instead of each “narrow by” filter having their own search bar, there could be one visible search bar and the filters could be dropdowns with either all or most popular options inside them.
User Journeys
Findings

Seafood Watch 2021 Dashboard -
Landing Pages
The majority of users (40.6%) start their website journey on the Home Page. Other top landing pages include Fishing and Farming Methods (7%) and Download Consumer Guides (5.5%).

Google Analytics - Popular Pages
The most popular pages include Download Consumer Guides and Fishing and Farming Methods which are also the top landing and exit pages with the highest bounce rates.
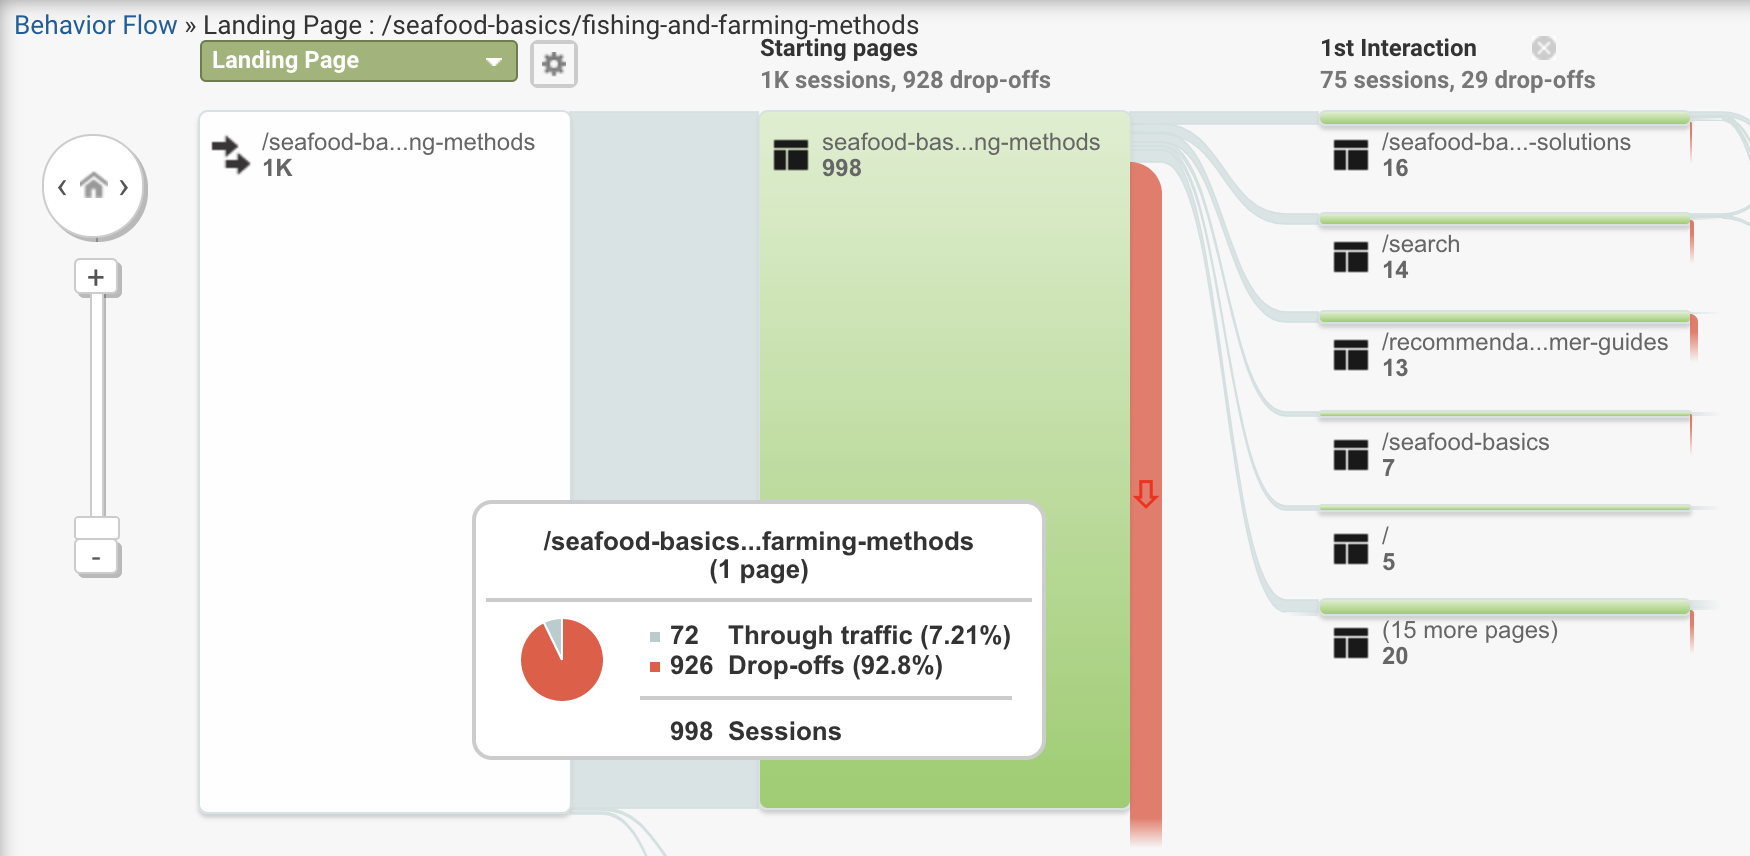
Google Analytics - Fishing and Farming Methods Behavior Flow
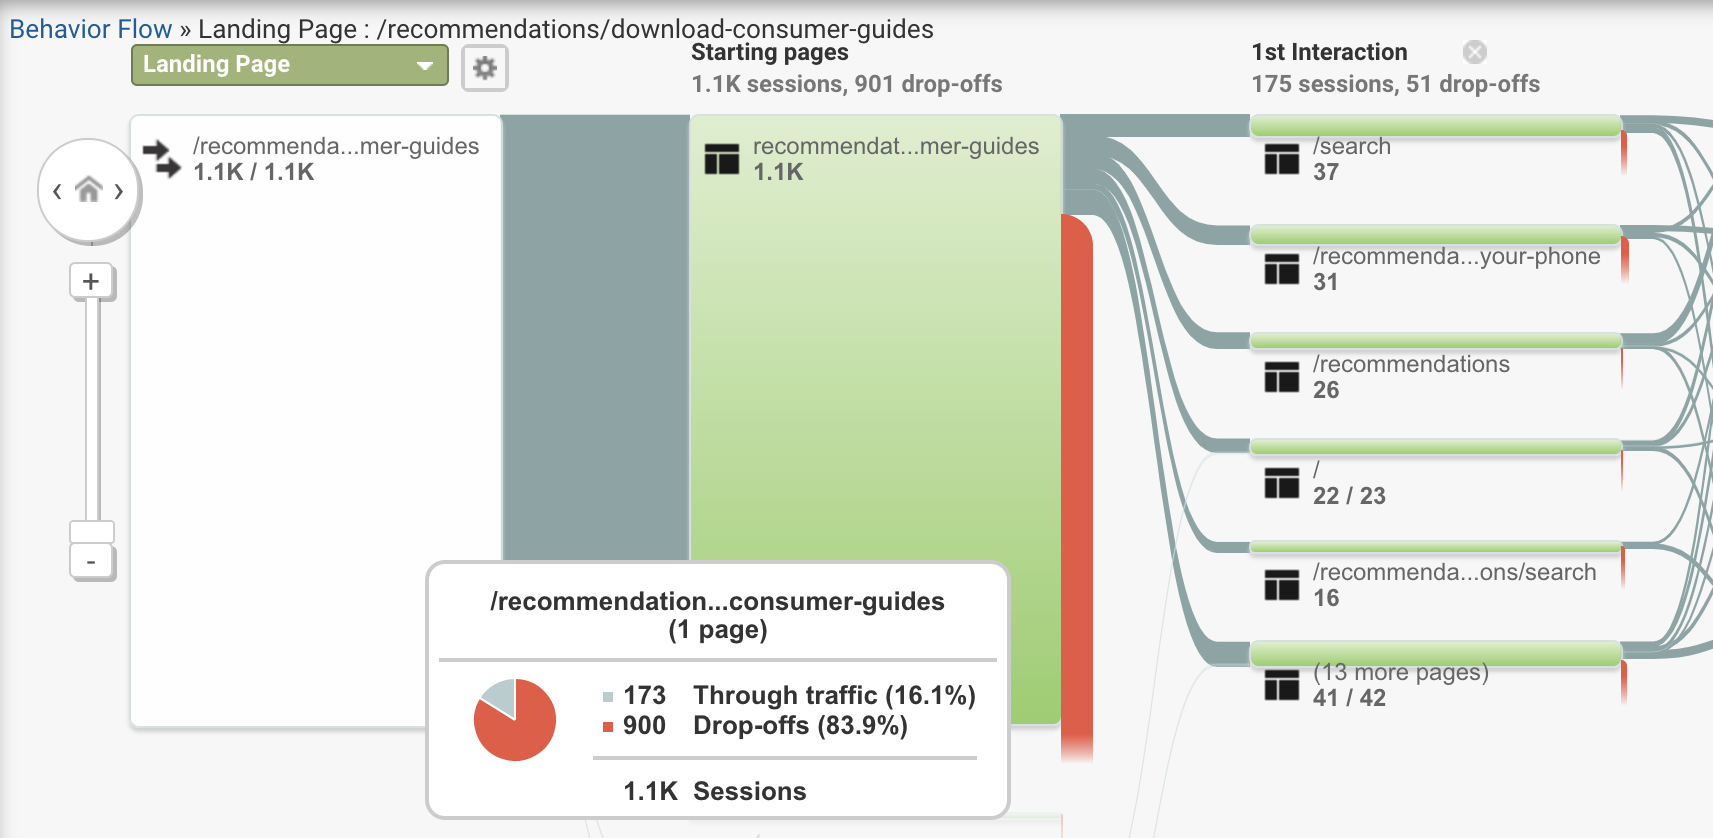
Google Analytics - Download Consumer Guides Behavior Flow
Majority of users (92.8%) starting on the Fishing and Farming Methods Page and 83.9% of users starting on the Download Consumer Guides Page will bounce than continue their website journey. Users are also more likely to visit the Global Search page or other popular pages than navigate to the Recommendations Search Page.
Recommendation
2. Add a recommendations search block on popular pages.
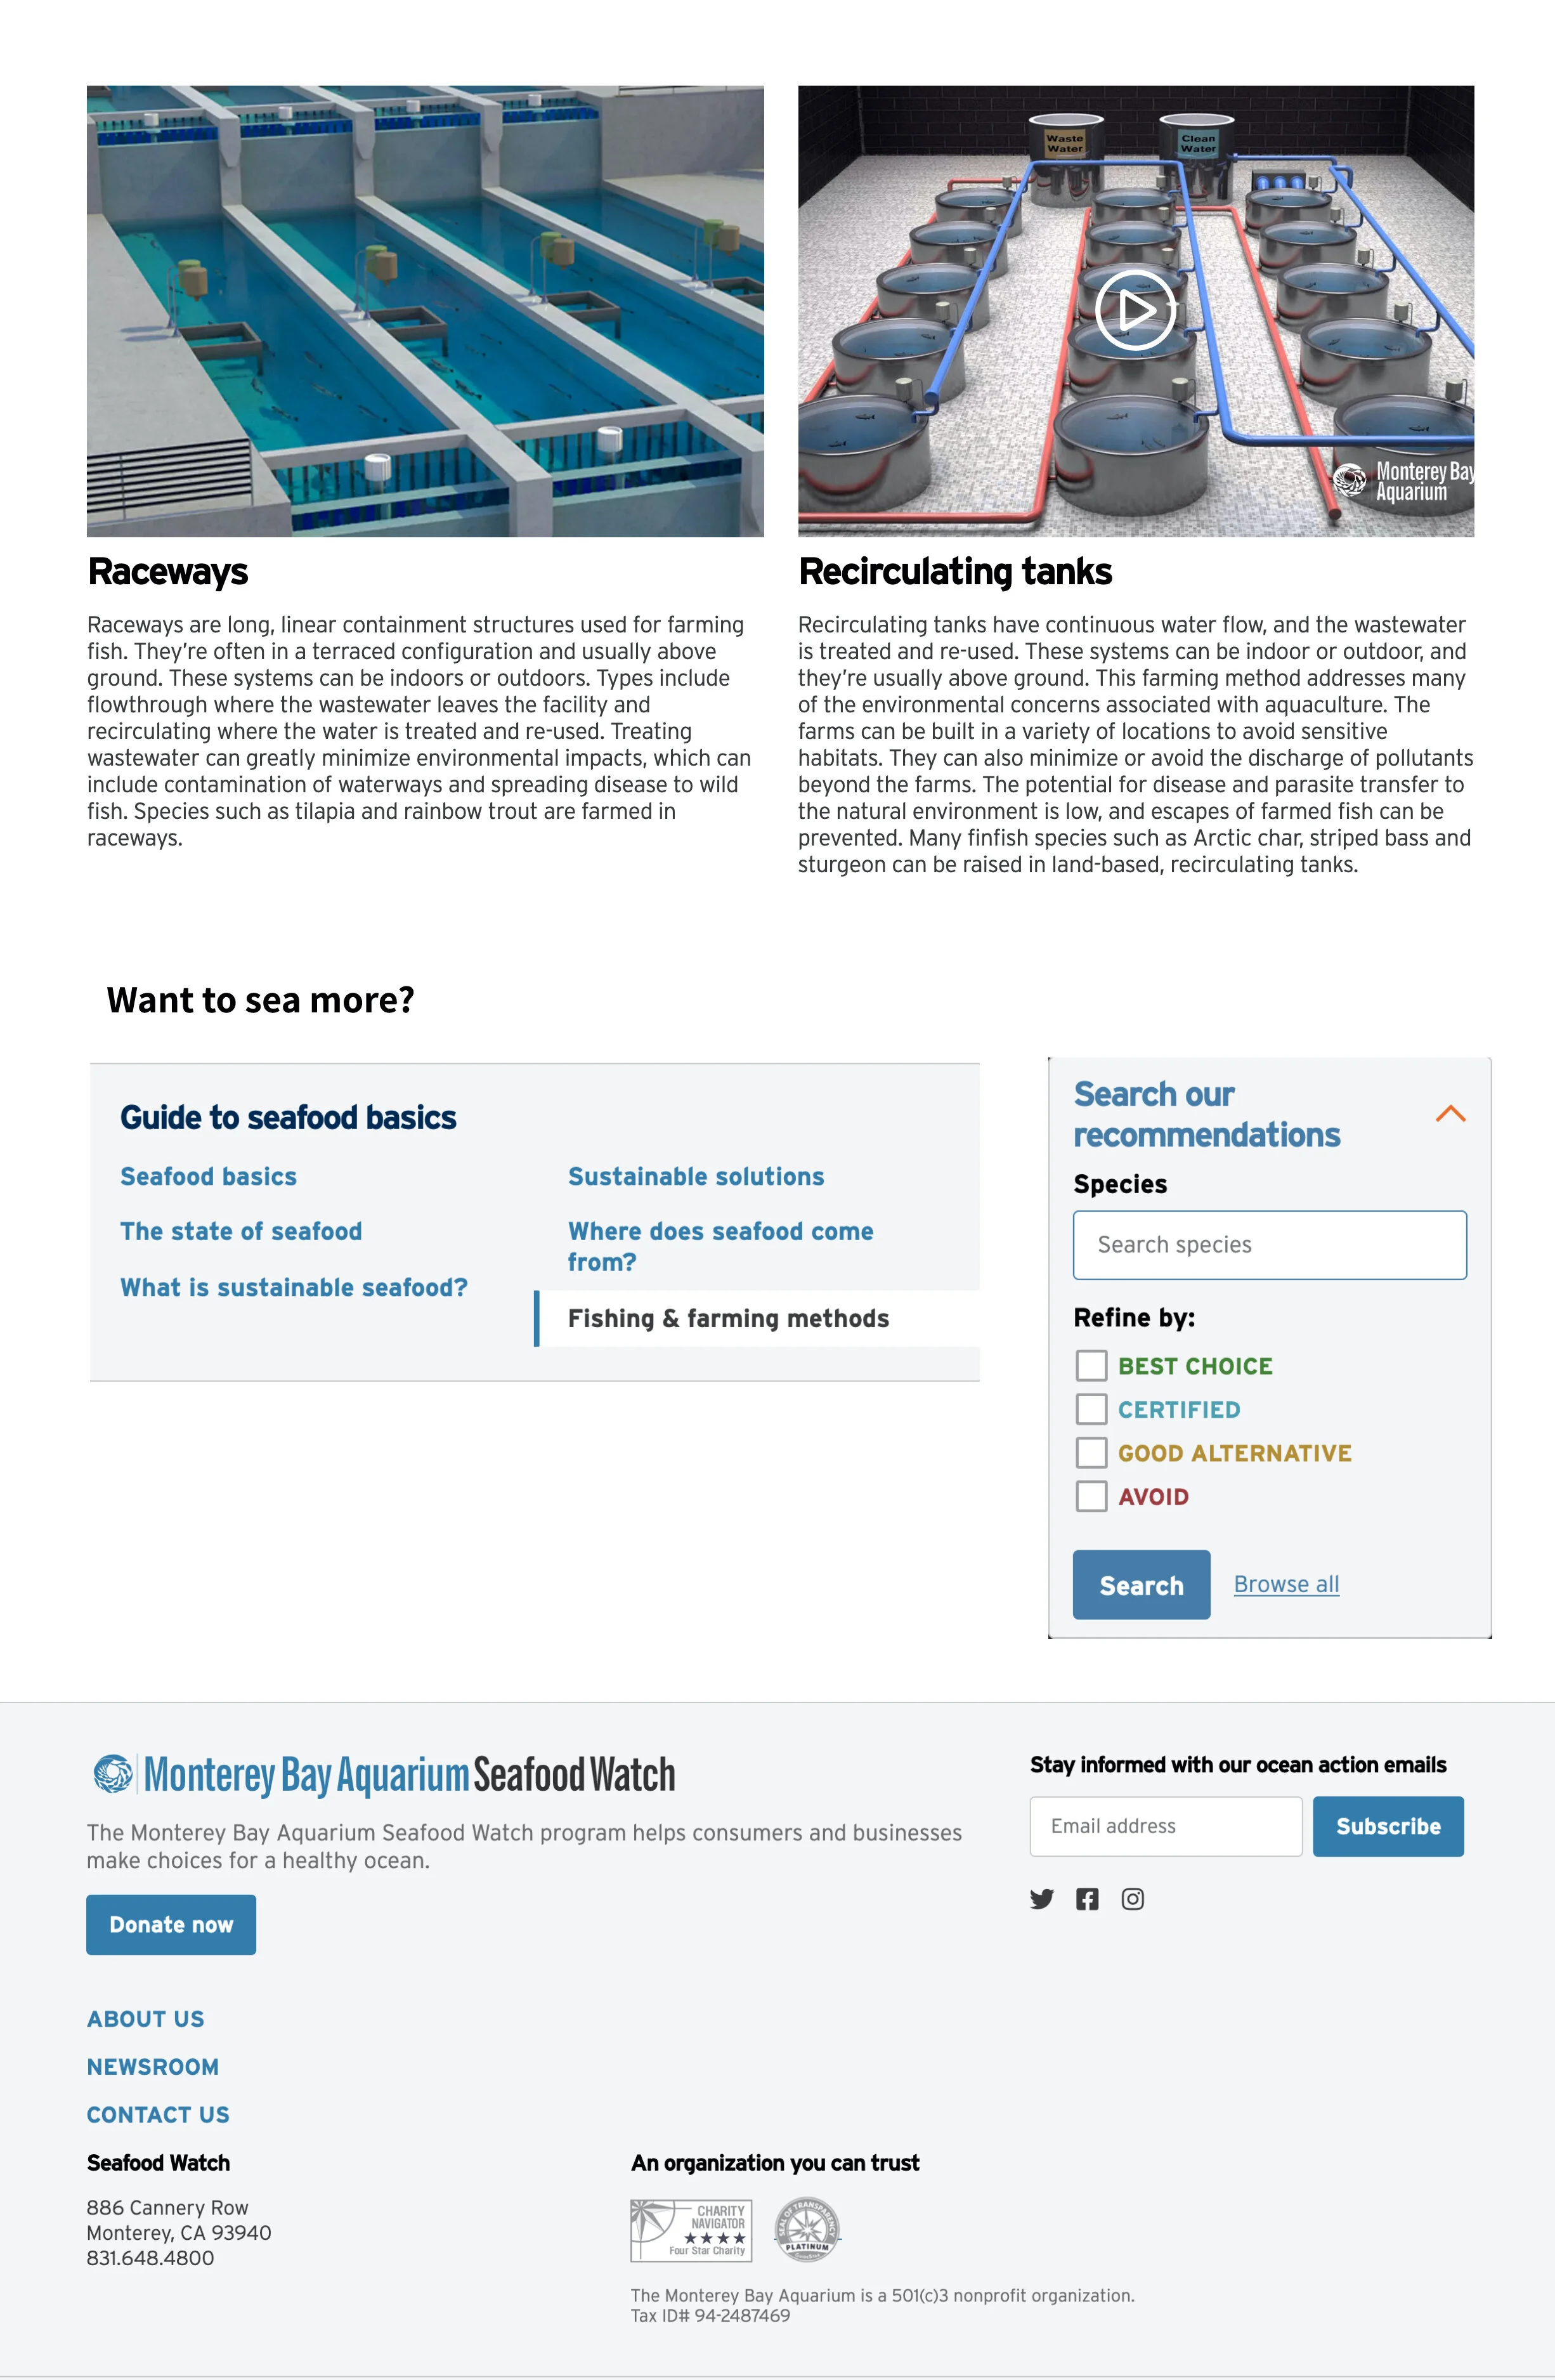
Mockup with a recommendations search block added to the end of Fishing and Farming Methods Page
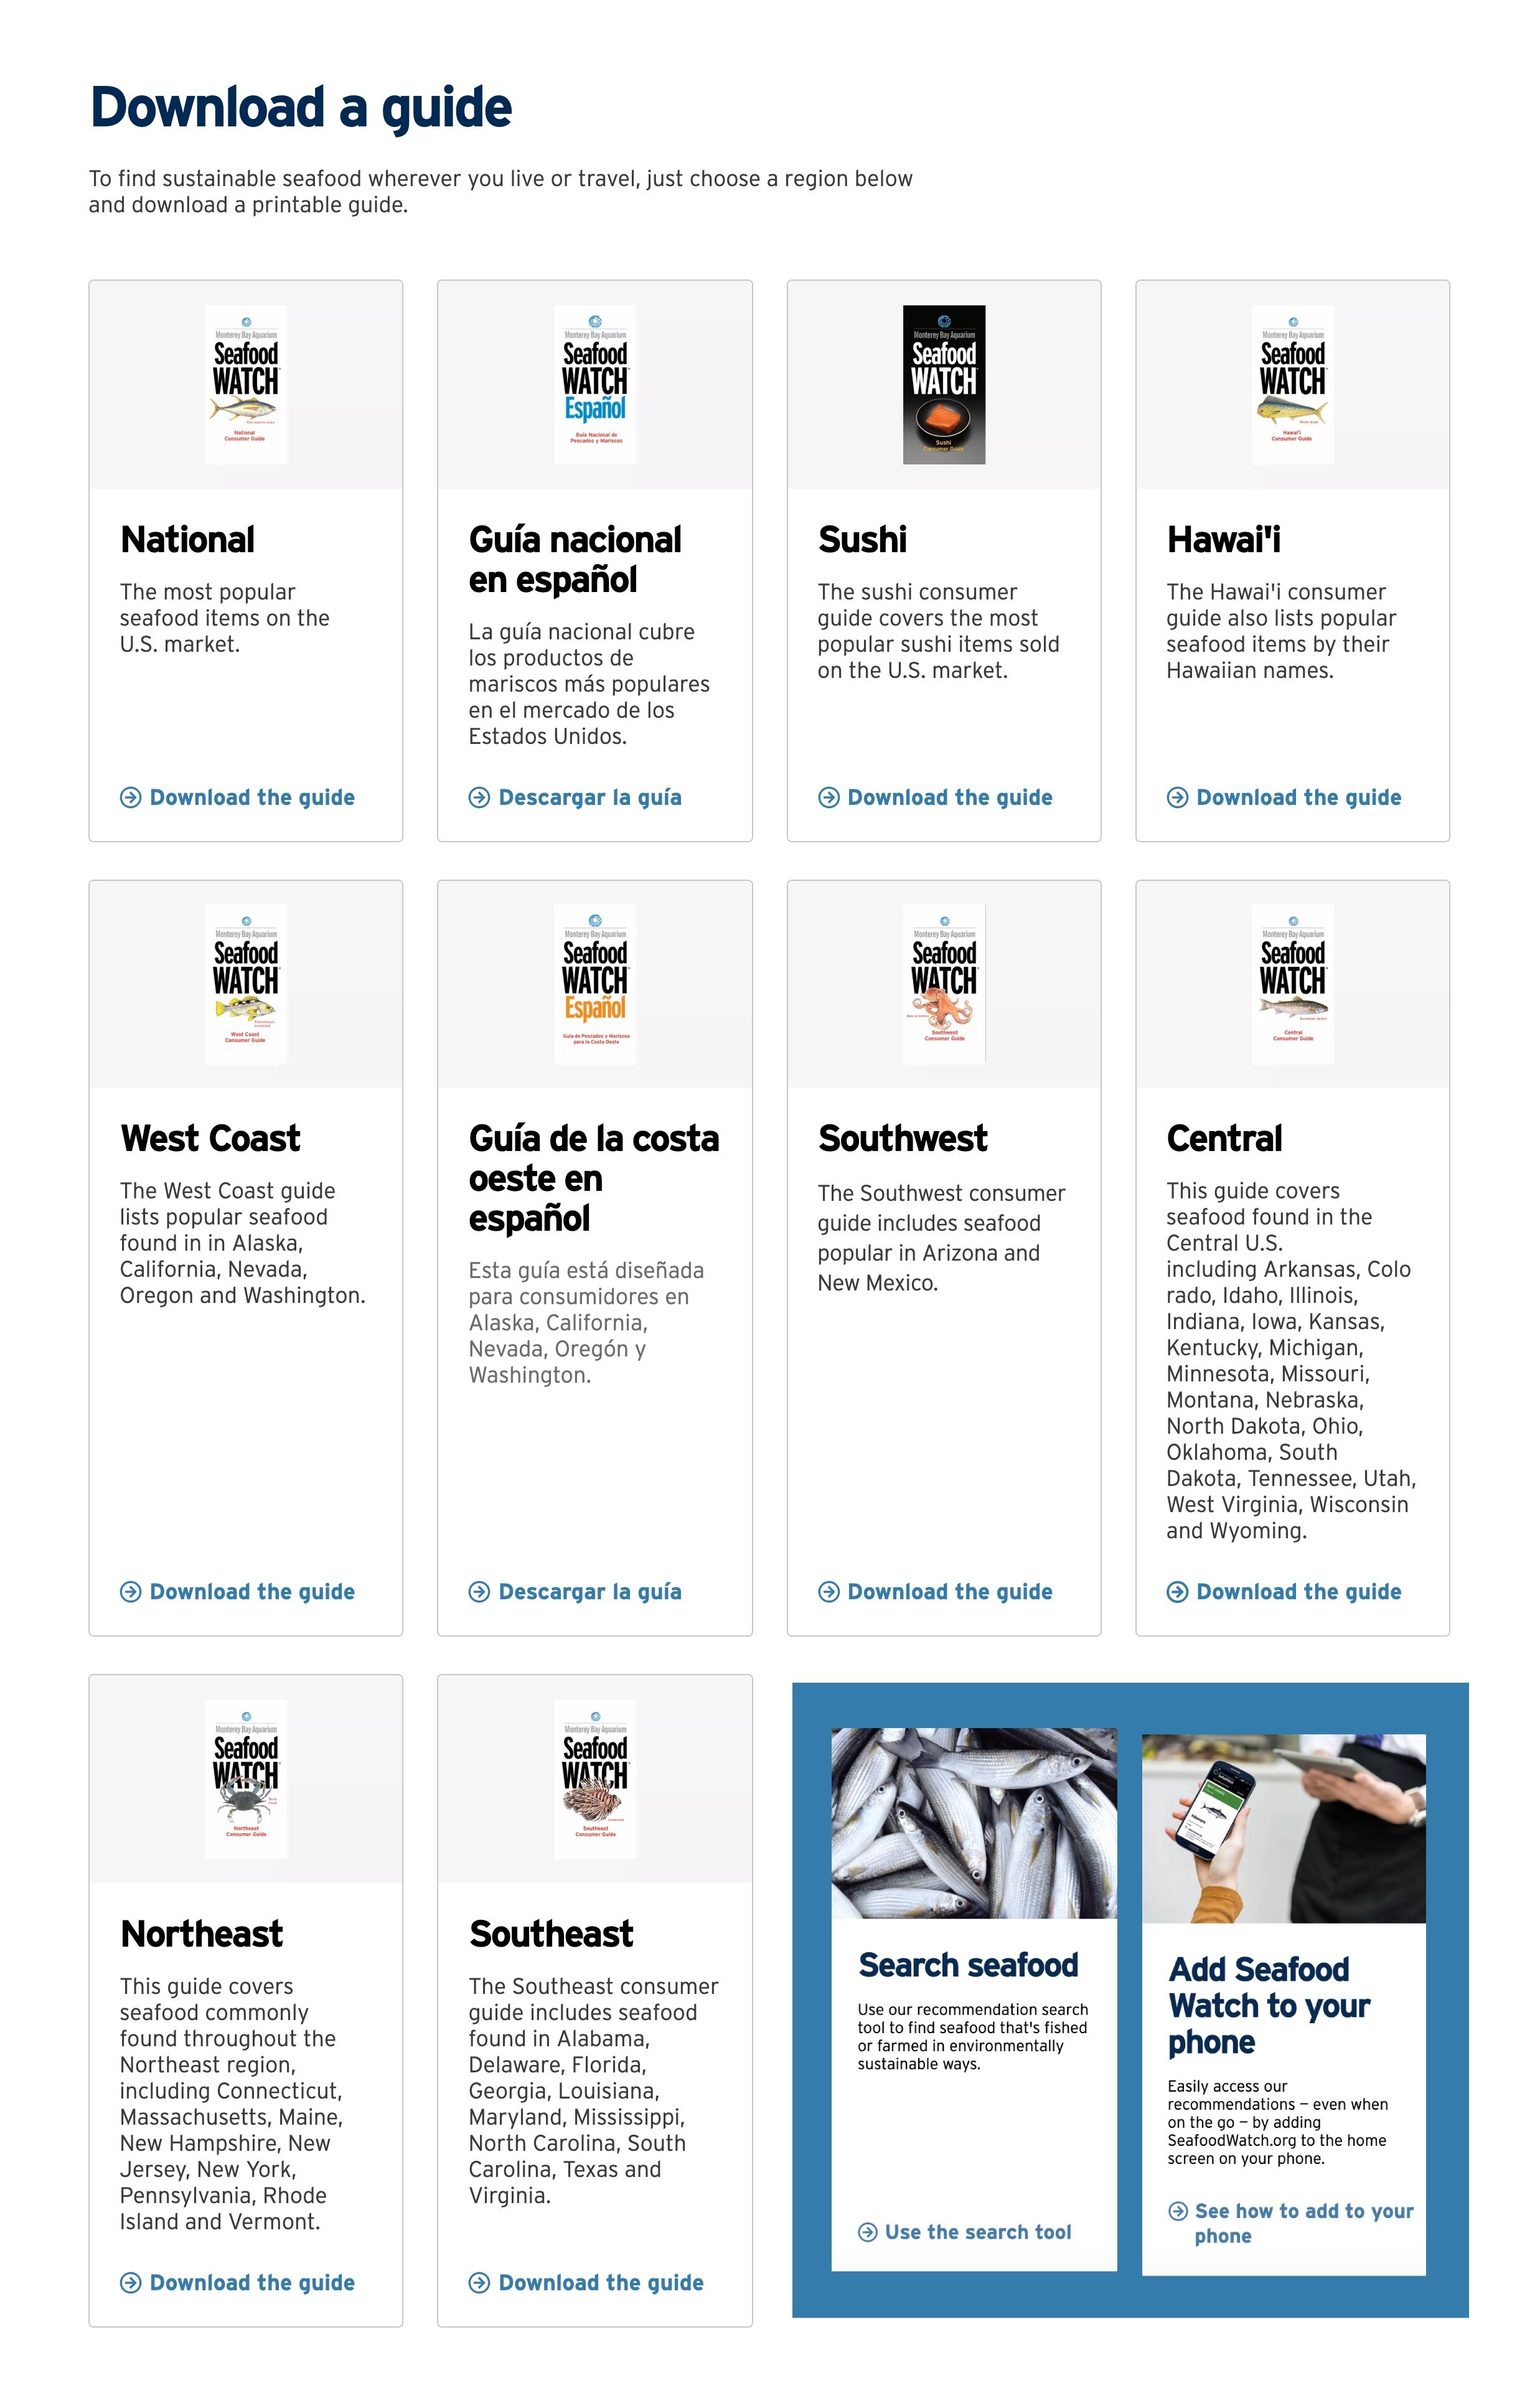
Mockup with links to to the recommendation search page and another popular page added to the end of Download Consumer Guides Page
Even though Fishing and Farming Methods and Download Consumer Guides are the top exit pages, the average time users spend on the page is 6:11 minutes and 2:46 minutes, respectively. This shows that users are engaged with the content before exiting. Our recommendation is to add a recommendations search block or links to other popular pages at the end of these pages to encourage users to use the recommendations search database and continue their website journey.
Traffic Sources
Findings
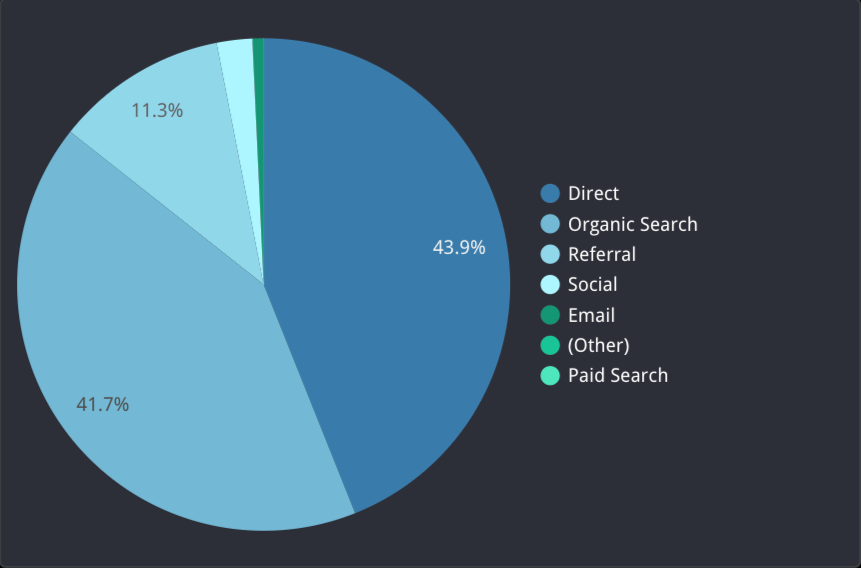
Seafood Watch 2021 Dashboard -
Traffic Channels
43.4% entered the website by way of Organic Search, while 41.9% of Seafood Watch users access its website directly.

Seafood Watch 2021 Dashboard -
Social Media Channels
Users coming from Social Media: 62% access the website via Facebook followed by Youtube at 22%. However, we found some Youtube links to be broken, titles not search optimized, and no tags used.

Seafood Watch 2021 Dashboard -
Traffic Sources by City in the United States
Most users access the website from NY, followed by LA.

Seafood Watch 2021 Dashboard - Traffic by Day of the Week
Most users are accessing the website during the middle of the week.
Recommendation
3. Improve response rates on social media.

Seafood Watch’s Facebook Page

Seafood Watch’s Youtube Account
Our recommendation is to improve response rates on social media by increasing resources and tools in that department. This will help promote user engagement which will increase the website's visibility.
We also recommend improving Seafood Watch’s YouTube account by optimizing the video description and adding related links to the official website, especially to the Recommendations Page. It will also be important to make sure all links to the official website are working properly. We recommend tagging videos with popular keywords related to the topic.
PDF Downloads
Findings

Seafood Watch 2021 Dashboard - Top PDF Download Count Site-Wide
7.11% of visitors download PDFs. Majority of PDF downloads occur on Consumer Guides Page and are Consumer Guides.

Seafood Watch 2021 Dashboard -
Top PDF Downloads on Recommendation Pages
Other PDF downloads occur on a variety of pages with a variety of content. However, Seafood Watch analytics does not currently distinguish between the type of PDF download, which became a limitation to our analysis.
Recommendation
4. Improve metrics to track PDF downloads and increase visibility of PDF download options.
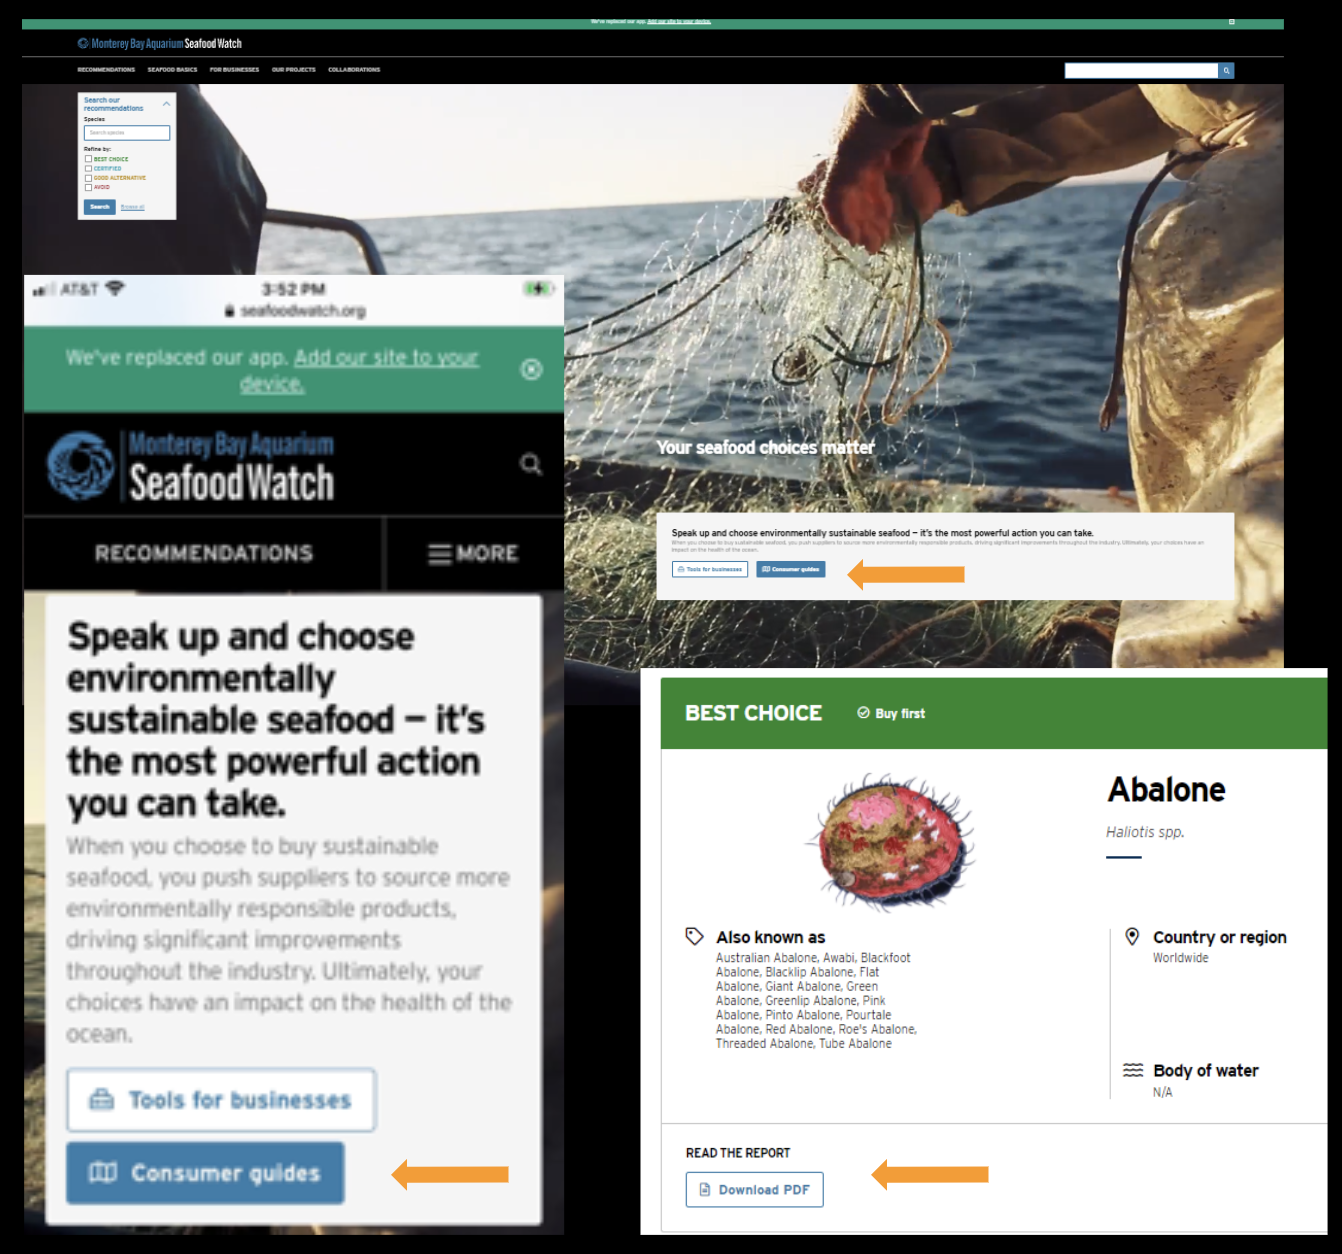
Mockups with action buttons
Downloading PDFs is a measurable indicator of how users are engaging with Seafood Watch content past the immediate website and if they are satisfied with the found results.
The visibility of consumer guides and other downloads could be much more prominent across the website by employing action buttons on relevant pages.
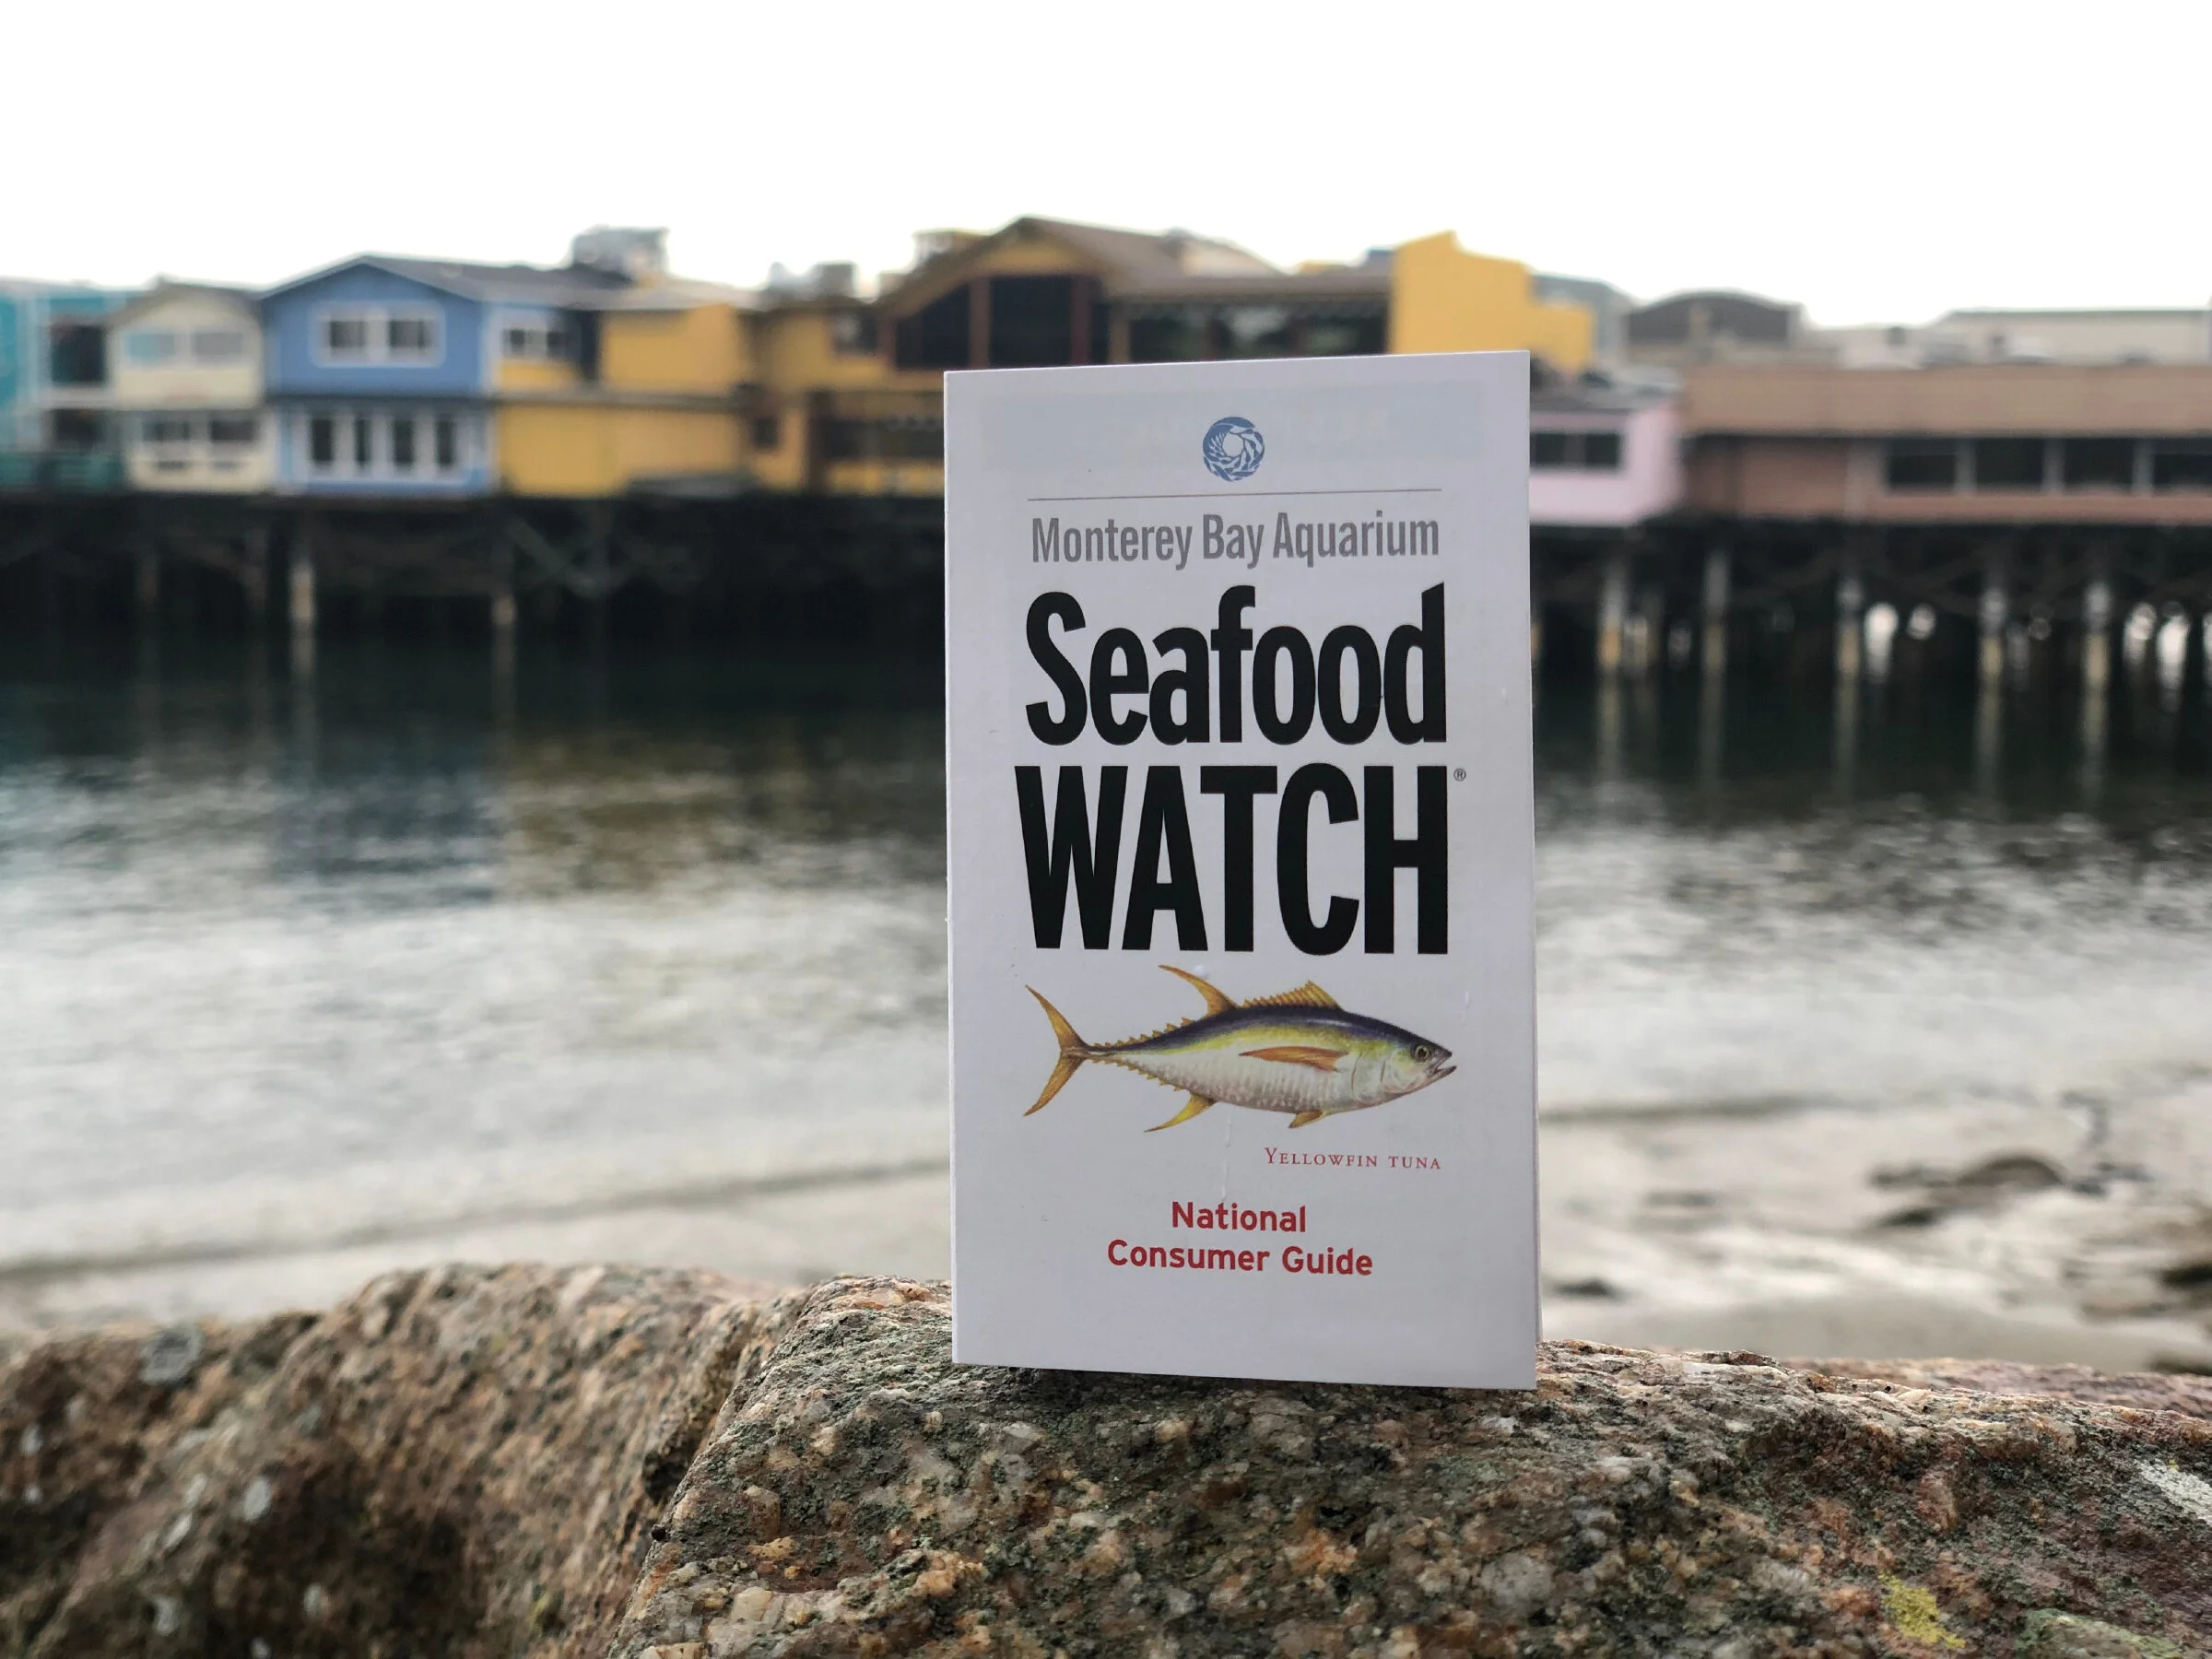
Photo credit: Monterey Bay Aquarium
CLIENT FEEDBACK
Meeting & Future Considerations
On May 7, 2021, our team presented our findings, recommendations, and dashboard to a few members of the Seafood Watch Team.
The response we received from our client was positive. They enjoyed our in-depth analysis of their user journeys and search behaviors, and found our findings mirror the challenges and complaints they have received from customers about their Global Search Page. They particularly enjoyed our recommendation of adding search blocks at the end of popular pages so users can continue their website journey.
If we were to continue working on this project, we would look into some of the limitations we mentioned– such as making sure each pdf is a separate event so we can track individual downloads. For future considerations, we suggest Seafood Watch to check that their popular species search matches with the analytics, as this may be the reason their Time After Search is incredibly high for the Global Search Page.
REFLECTION
Conducting a data analysis evaluation for a real client has been insightful and rewarding. It was especially helpful that our clients knew exactly what they wanted, and as a team, we were able to work efficiently together to deliver successful products.
This was my first time using data analytics tools to write a report. Unlike user-testing which can be subjective, I find data analysis to be even more persuasive and convincing when you are using numbers and facts to tell your story. The major takeaway from this project is to be careful drawing conclusions from one metric alone. For instance, having a high bounce rate or % exit doesn’t necessarily mean it’s a bad thing. It’ll be important to compare these numbers with other metrics such as avg. duration on page or page depth to get a bigger picture.
DELIVERABLES: