
Apple Health Data Visualization
ABOUT THE PROJECT
The goal of this project was to restructure my Apple health data to track my step counts from 2016 to 2020. The original data exported from the Apple Health app was messy and unstructured. Using OpenRefine, I cleaned the data to visualize the total steps for each year, month, and day of the week to understand my current health status and be more mindful of my step counts and goals for 2020.
WHY PURSUE A QUANTIFIED SELF?
There are many reasons people feel motivated to track their lives. The main one is personal data is easy to collect. Before the project, I never realized how many apps were already collecting my data without my knowledge. I’m thankful to have stumbled across my apple health data so I can document my behaviors for the past 4 years just from simply carrying my iPhone in my pocket.
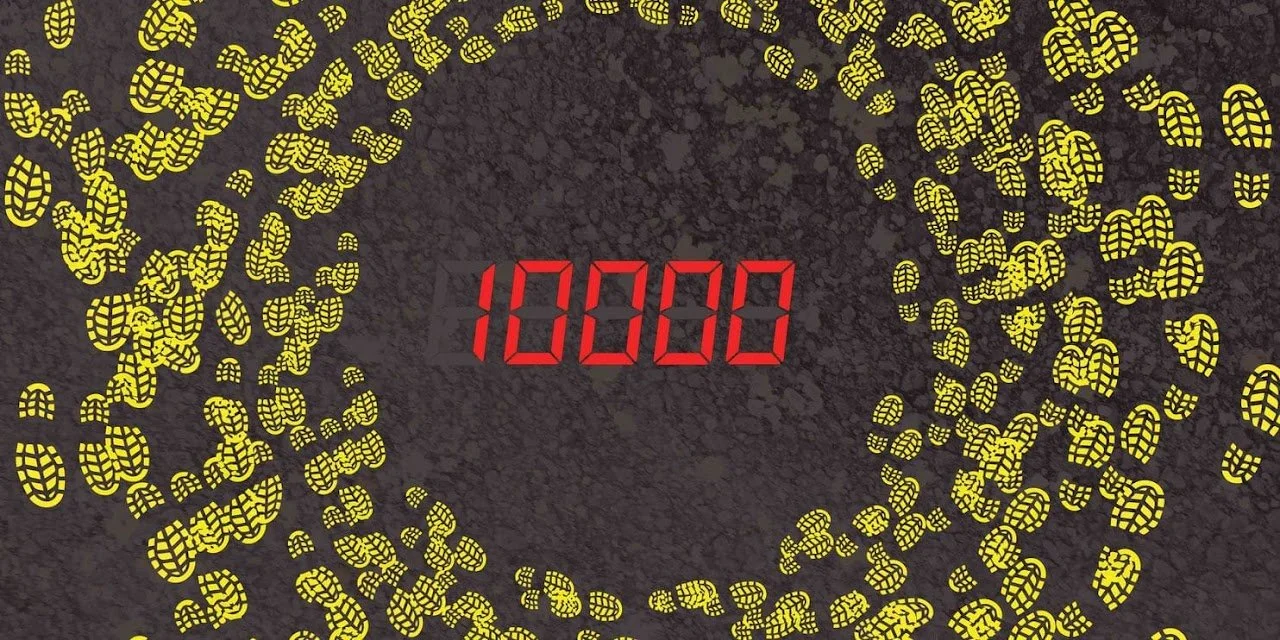
Even though this may not be the most accurate way to keep track of my steps but it is by far the easiest. It can also be said the greatest benefit of visualizing personal health data is that it can be used for self-improvement. Seeing how my trend lines fall under the average steps of 10K, and how I’ve had only 9 days with over 25K steps, motivates me to make lifestyle changes for 2020.
DATE
February 28, 2020
DATASET
Apple Health Data
DATA VISUALIZATION TOOLS
OpenRefine
Tableau Public
