
COVID-19 & Pratt Data Visualization
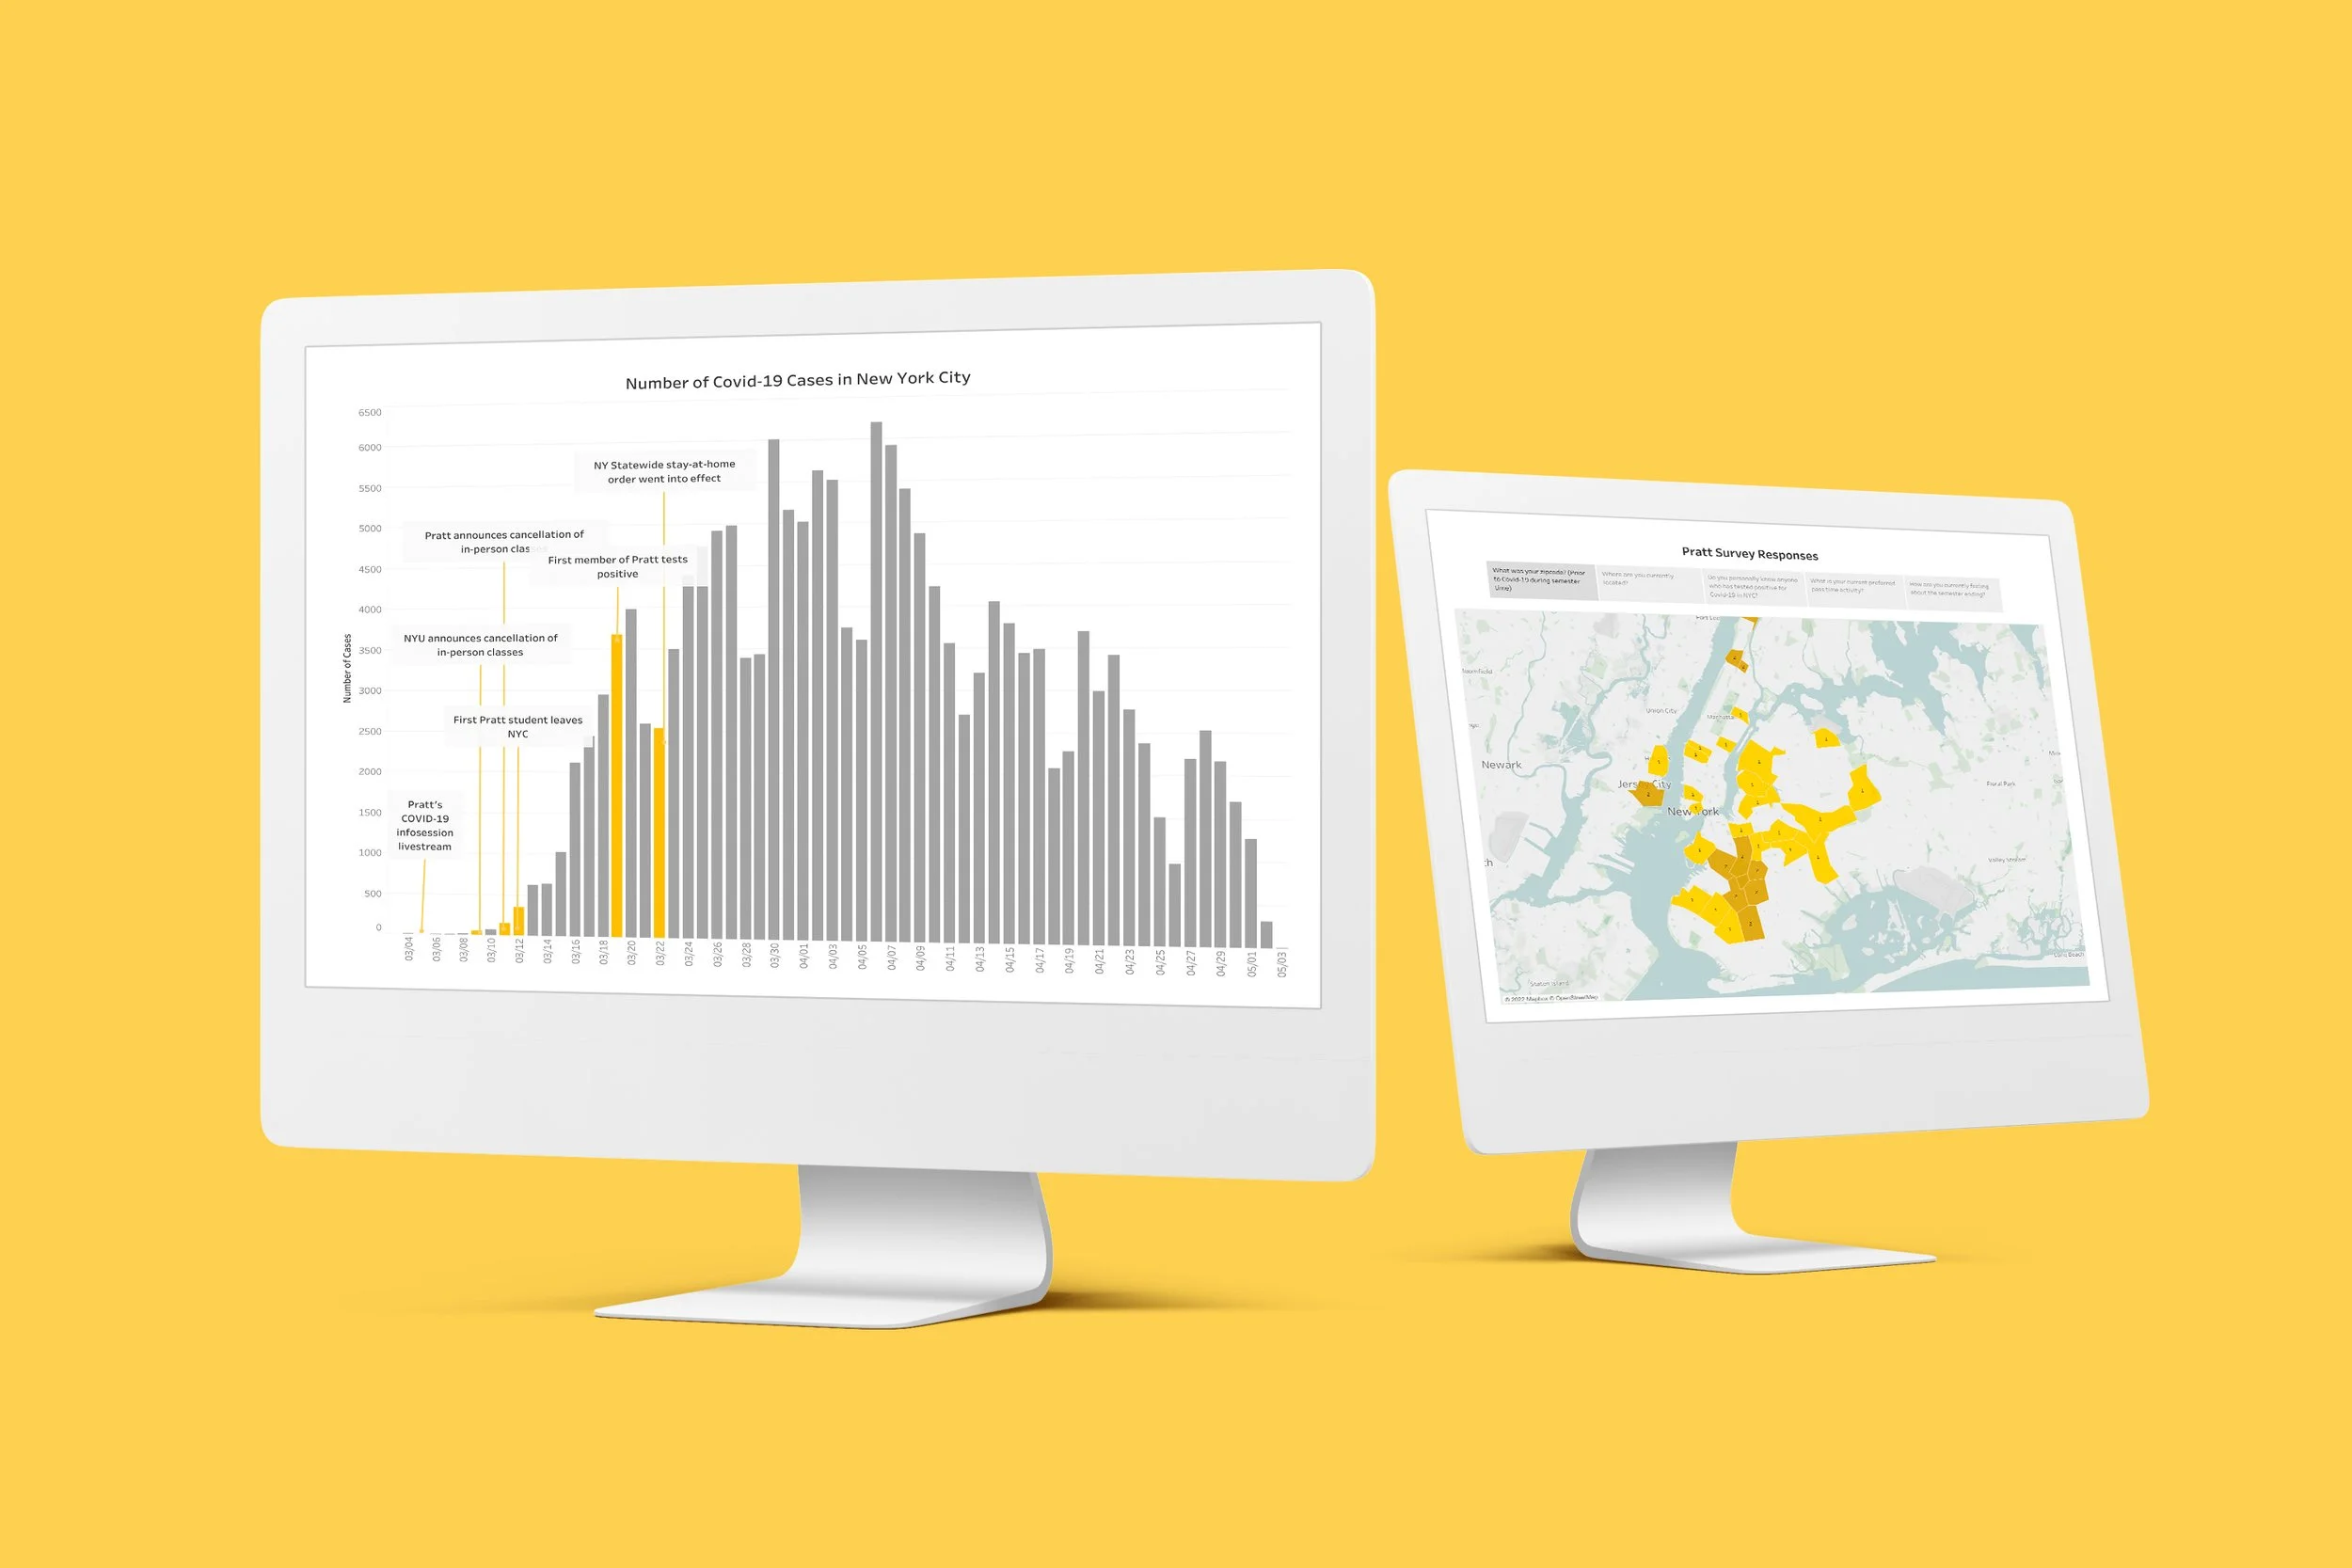
ABOUT THE PROJECT
In light of recent events, there is no doubt COVID-19 has been on everyone's minds. It has affected the way we perform our daily routines, the way we travel, and even in the way we interact. As Pratt announced its transition to online classes in early March, our group was curious to know: How has COVID-19 impacted the Pratt Community?
UX RESEARCH
A user test was conducted by sending out a google survey to Pratt's listserv. There are 9 questions in total, with the survey constructed in a way that will allow us to visualize multiple kinds of variables. A total of 52 graduate students from Pratt School of Information participated in our survey. The datasets were cleaned on OpenRefine, then visualized on Tableau Public.
DATE
May 7, 2020
DATASET
DATA VISUALIZATION TOOLS
OpenRefine
Tableau Public
TEAM MEMBER
Celine Yap
